By Datapleth.io | August 12, 2019
Accessing to satellite images based on geolocalization has many applications in data visualization and data sciences.
There are several alternative of services which provide API interfaces which can be integrated in notebooks or articles, for instance : Google Maps, Bings Maps, OpenStreetMap, … You can find free, freemium or premium services. In this post we are going to illustrate a short demo of mapbox satellite API.
Mapbox present itself as the “location data platform for mobile and web applications”. Their service is quite reactive, provide good resolution images and is free up to a significant amount of API calls (70 000) and quite cheap afterwards.
Preparation
We will need first several geographical and graphical libraries of R
library(knitr)
library(kableExtra) # for table rendering
library(glue)
library(curl)
library(slippymath)
library(purrr)
library(png)
Then a mapbox API key will be necessary, you can register for free on mapbox. Documentation is available here.
We store this API key in our system environment and load it in the session. We define as well the latitude and longitude of our point of interest and define the dimensions around this point we want to visualize. This zone will be our bounding box. We define finally the zoom level.
api_mapbox <- Sys.getenv("API_MAPBOX")

my_long <- -13.915188
my_lat <- 65.549621
delta_long <- 0.2
delta_lat <- 0.1

myBbox <- c(xmin = my_long - delta_long,
            ymin = my_lat - delta_lat,
            xmax = my_long + delta_long,
            ymax = my_lat + delta_lat
)

zoom_level <- 11
Prepare the grid
Satellite imagery providers uses vector tile to create maps. You can read the specification of mapbox on their website. The concept is simple, an image is made of tiles, the number of tiles will depend on the size of the bounding box you defined and the zoom level (the image quality). We will have to download each tile and make the assembly in one large image.
More resolution means larger image, longer time to download.
The excellent slippymath package will be our friend to manipulate such grid.
So, firstly, we determines how many tiles the bounding box would occupy for a range of zooms.
# Get the grids reference for each level of zoom
myBboxTile <- slippymath::bbox_tile_query(bbox = myBbox)
# Visualise for our chosen level of zoom and around
myBboxTile[(zoom_level-2):(zoom_level+1),] %>%
    kable() %>%
kable_styling(bootstrap_options = c("striped", "hover"))| x_min | y_min | x_max | y_max | y_dim | x_dim | total_tiles | zoom | |
|---|---|---|---|---|---|---|---|---|
| 9 | 471 | 262 | 472 | 263 | 2 | 2 | 4 | 10 |
| 10 | 943 | 524 | 945 | 526 | 3 | 3 | 9 | 11 |
| 11 | 1887 | 1048 | 1891 | 1053 | 6 | 5 | 30 | 12 |
| 12 | 3774 | 2096 | 3783 | 2107 | 12 | 10 | 120 | 13 |
We see that at zoom level of 11 we have 9 tiles and their associated numbering range in x and y. We will now get the chosen grid details.
# Get the grid references
myGrid <- slippymath::bbox_to_tile_grid(myBbox, zoom = zoom_level)
Getting Satellite imagery from the API
We will now query in loop the mapbox API to download each tile of our grid one by one.
setwd(dir = "./sat/") # image will be stored in that sub directory
## This is mapbox API url, two options, the @2x has a double resolution
mapbox_query_string <-
paste0(
#"https://api.mapbox.com/v4/mapbox.satellite/{zoom}/{x}/{y}.jpg90",
"https://api.mapbox.com/v4/mapbox.satellite/{zoom}/{x}/{y}@2x.jpg90",
"?access_token=",
api_mapbox
)
## purrr package is our friend to crawl the grid for each tile
myTiles <- purrr::pmap(
.l = myGrid$tiles,
zoom = myGrid$zoom,
.f = function(x, y, zoom){
outfile <- glue::glue("{x}_{y}.jpg")
curl::curl_download(
url = glue(mapbox_query_string),
destfile = outfile
)
return(outfile)
}
)
## Given our tile_grid and a list of images,
## compose a single spatially referenced RasterBrick object.
mySat <- slippymath::compose_tile_grid(myGrid, myTiles)
## Go back to root directory
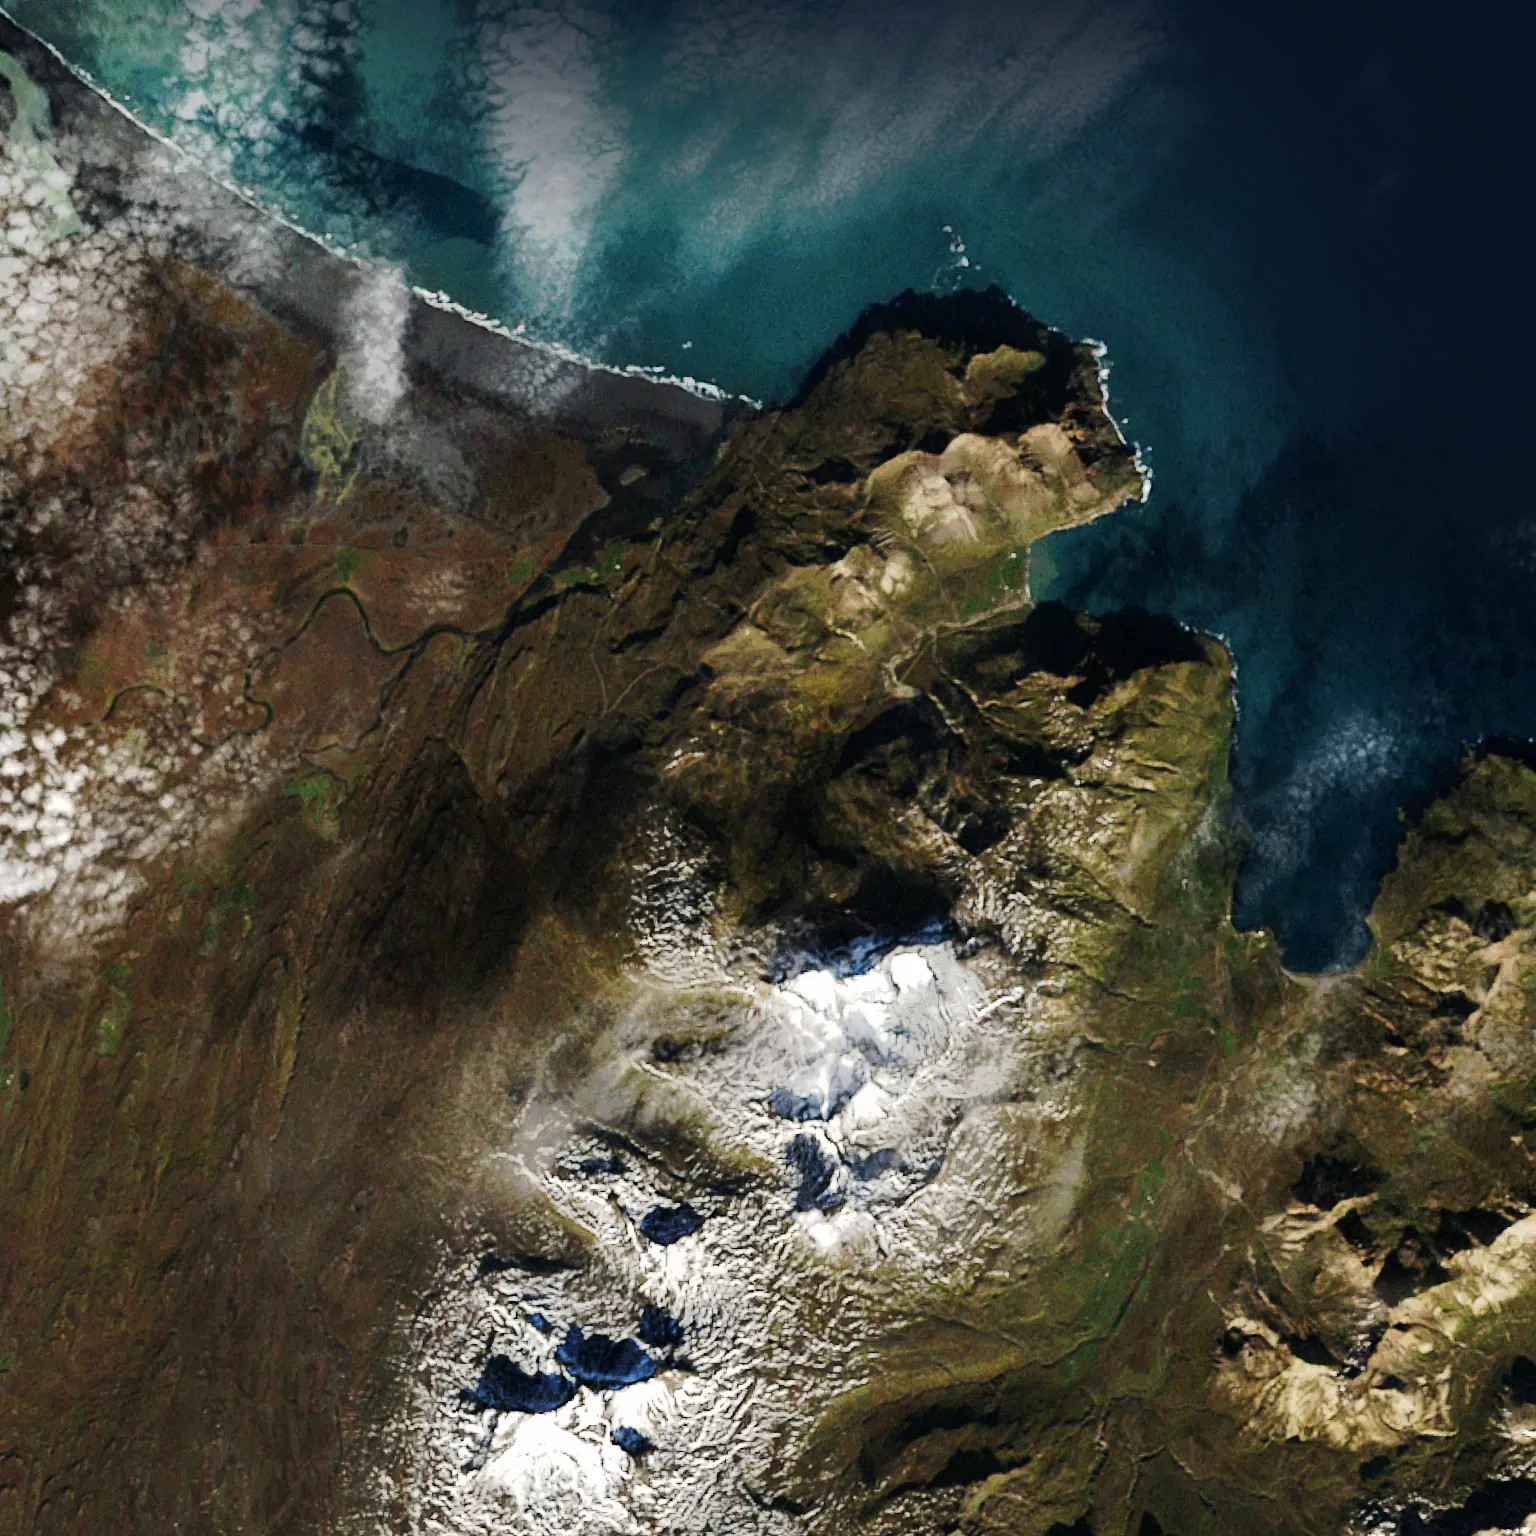
setwd(dir = "../")Finally we convert the RasterBrick object to a png which is shown bellow.
slippymath::raster_to_png(mySat, "./img/example_satellite_mapbox_0.png")
knitr::include_graphics("/blog/img/example_satellite_mapbox_0.png")