By Datapleth.io | May 21, 2016
We have a project aiming at Air Quality Predictions (see other posts on the same topic) from past air quality data and weather conditions.
In a previous post we have downloaded air quality data for Shanghai, Beijing, Chengdu, Guangzhou, Shenyang and Paris. In this post we will get the associated weather data using web scrapping.
There are several options for weather report website providing historical hourly data for weather station :
- The excellent wunderground gives access to
daily csv files for weather station, this is probably the best source of this available. In this case, the function
read.csv()will do the job with the right URL configuration - An alternative is to use API, such as openweathermap api. This option is technically the best but unless you need limited data, their will be a cost in most of the case
- Old school web scraping of weather website
We will here illustrate the later with the use of the excellent package rvest
to scrape web data.
Overall Process :
- Find a proper website providing historical hourly weather data (is possible in tabular format)
- Get for each city the associated URL
- Build a loop scrip which access the daily data, scrape it and compile a data frame
- Clean the data
- Do basic exploratory analysis to check if everything is fine
Required libraries
We need several R packages for this study.
## Needed libraries and system configuration
library(XML)
library(rvest)
library(data.table)
library(dplyr)
library(lubridate)
library(ggplot2)
library(ggthemes)
Sys.setlocale("LC_CTYPE", "en_US.UTF-8")
## [1] "en_US.UTF-8"Find data sources
Weatherbase
Few minute duckducking gives access to several website with hourly historical weather data, we will use here http://www.weatherbase.com which gives access to web page with hourly historical weather data in a tabular form for the cities listed in introduction
Configuration of data source
The code bellow will generate a data frame storing the names of cities with their weather URL pattern. We will see later that these URI needs to be completed with date of wished record.
## Data Configuration
# City Url
uriCityWeather <- data.frame(
        city = c(
                "Shanghai","Beijing","Chengdu","Guangzhou","Shenyang","Paris"),
        url = c(
                "http://www.weatherbase.com/weather/weatherhourly.php3?s=76385&cityname=Shanghai-Shanghai-China&date=",
                "http://www.weatherbase.com/weather/weatherhourly.php3?s=11545&date=2016-03-22&cityname=Beijing-Beijing-China&date=",
                "http://www.weatherbase.com/weather/weatherhourly.php3?s=49265&cityname=Chengdu-Sichuan-China&date=",
                "http://www.weatherbase.com/weather/weatherhourly.php3?s=78295&cityname=Guangzhou-Guangdong-China&date=",
                "http://www.weatherbase.com/weather/weatherhourly.php3?s=24345&cityname=Shenyang-Liaoning-China&date=",
                "http://www.weatherbase.com/weather/weatherhourly.php3?s=94170&cityname=Paris-Ile-de-France-France&date="))
Preparing the scraping plan
We will need 3 years archives for our project, for each city. The code bellow configure the plan for scrapping. Basically we are going to loop this data frame to access each city records. For this post, we will just illustrate how to scrap the last few days of December month for each city in 2015, you can uncomment the code to get the full historical data.
# on this example we chose fews days at the end of 2015
dates4scrapping <- seq(as.Date("2015-12-25"),
                       as.Date("2015-12-31"),
                       by="days")
Scraping the data
Prepare the job
We first name the features to be used from weatherbase
weatherbase_columns <-  c(
        "local_time",
        "temperature",
        "dewpoint",
        "humidity",
        "barometer",
        "visibility",
        "wind_direction_code",
        "wind_speed",
        "gust_speed",
        "precipitation",
        "events",
        "conditions"
)
The main scraping scrip is highlighted in the code bellow. The most important is to find the right Xpath expression to access the data table in the webpage. Several chrome or firefox extensions can help (check firebug extensions).
## a Function to scrap the data
getDayWeather <- function(
        date, # as yyyy-mm-dd
        city_name, # name of the city, eg. Beijing
        city_base_url # weatherbase base url
){
        # Make base url
        my_url <-paste0(
                city_base_url,
                date,
                "&units=metric"
        )
        message(paste0(city_name," - ", date))

        # Xpath to get the whole Table
        # //*[@id="left-weather-content"]/table[3]
        DayWeather <- my_url %>%
                read_html() %>%
                html_nodes(xpath = '//*[@id="left-weather-content"]/table[3]') %>%
                html_table()
        # if data is not empty
        if(length(DayWeather) > 0){
                DayWeather <- as.data.table(DayWeather)
                setnames(DayWeather, weatherbase_columns)
                ## add new features
                DayWeather[ , ':=' (
                        city = city_name,
                        date_obs = date,
                        url = my_url
                )
                ]
                ## clean data
                DayWeather[ , ':=' (
                        date_time = as.POSIXct(
                                strptime(
                                        paste(date_obs,local_time),
                                        format = "%Y-%m-%d %I:%M %p")
                        )
                )]
        } else {
                DayWeather <- NULL
        }
        return(DayWeather)
}
Scrapping
weather_data <- list()
for( my_city in uriCityWeather$city){
        my_data <- lapply(
                dates4scrapping,getDayWeather,
                city = my_city,
                city_base_url = uriCityWeather[ uriCityWeather$city == my_city,]$url
        )
        weather_data[[my_city]] <- rbindlist(my_data)
}
weather_data <- rbindlist(weather_data)
Clean the data
Most the information is extracted as text and as the website add additional symbols, we proceed to data cleaning with the following code.
weather_data[ , ':=' (
        temperature = as.numeric(gsub(pattern = "(.*) \302\260C","\\1",temperature)),
        dewpoint = as.numeric(gsub(pattern = "(.*) °C","\\1",dewpoint)),
        humidity = as.numeric(gsub(pattern = "(.*) %","\\1",humidity)),
        barometer = as.numeric(gsub(pattern = "(.*) hPa","\\1",barometer)),
        visibility = as.numeric(gsub(pattern = "(.*) km","\\1",visibility)),
        Wind_direction_degree = as.numeric(gsub(pattern = ".* \\((.*)°\\)","\\1",wind_direction_code)),
        wind_direction_as_code = gsub(pattern = "^(.*) \\(.*$",replacement = "\\1",x = wind_direction_code),
        wind_speed = as.numeric( gsub(pattern = "(.*) km/h","\\1",wind_speed)),
        gust_speed = as.numeric( gsub(pattern = "(.*) km/h","\\1",gust_speed))
)]
Exploratory Analysis
Let’s visualize a simple plot to check our scraped data
g <- ggplot(data = weather_data) +
  theme_tufte() + #theme(legend.position = "none") +
  geom_line(aes(x = date_time, y = temperature, col = humidity)) +
  geom_hline(yintercept = 0, color = "grey") +
  facet_grid(facets = . ~ city) +
  ggtitle("Temperature in few cities during the last few days of december 2015") +
  xlab("Hours from new year's midnight") +
  theme(axis.text.x = element_text(angle = 90)) +
  theme(axis.title.x = element_text(margin = margin(t = 20, r = 0, b = 0, l = 0))) +
  ylab("Temperature in °C") +
  scale_color_gradient2(midpoint=50, low="blue", mid="green",high="red", space ="Lab" )
  # scale_color_brewer(palette="Dark2") #Dark2 as alternative

ann_text <- data.frame(
        date_time = min(weather_data$date_time),
        temperature = 18,
        lab = "Text",
        city = factor("Shenyang",levels = unique(weather_data$city))
)

g <- g + geom_text(data = ann_text, aes(x = date_time, y = temperature),
                   label = "(c) datapleth.io
Data from
www.weatherbase.com", col = "black", size = 2, hjust = 0)
g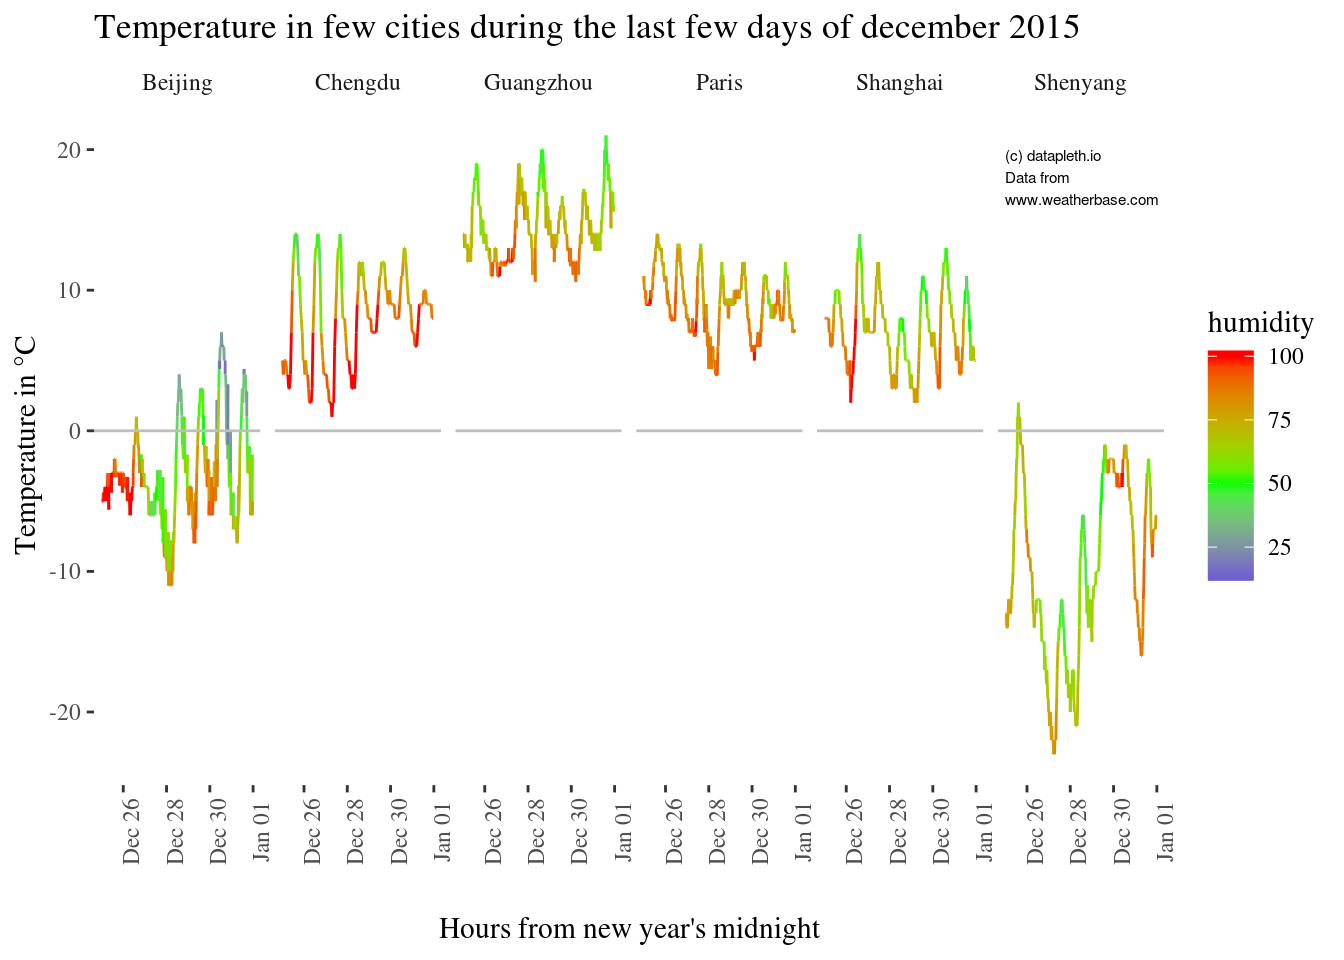
Conclusion
This short example illustrate that web scraping can be quite easy with the package rvest, the most difficult part is to find the right Xpath expression and the right approach to loop over the content.