Dataviz

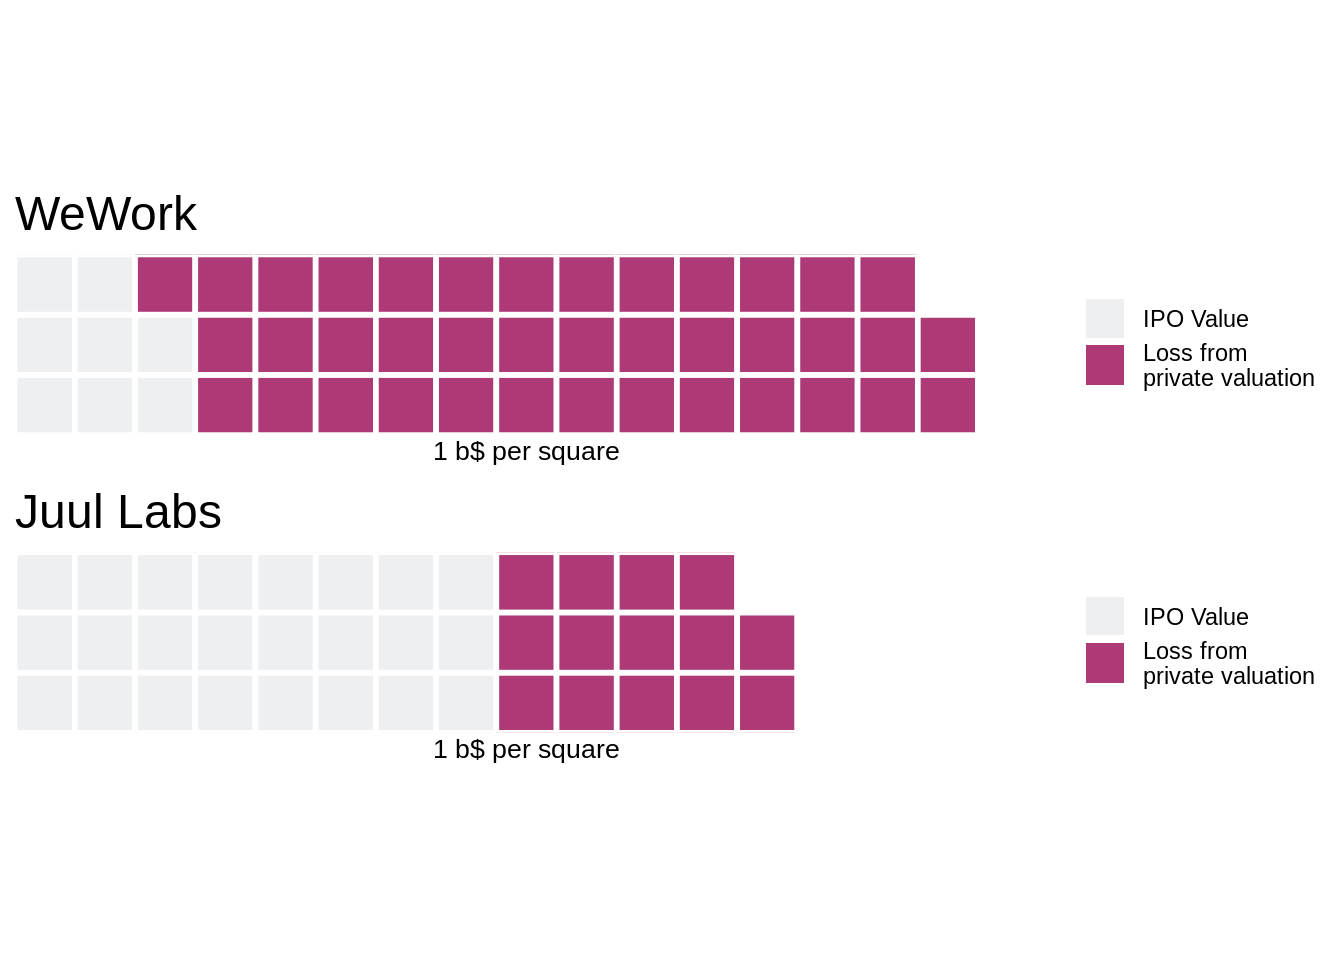
The unicorn bubble - Donuts or Waffles ?

How Silicon Valley feels right now ? Few days ago the Wall Street Journal (@WSGGraphics) published a tweet about Unicorns loosing value between their last private-market valuation and their IPO price. In this post, we will replicate their visuals and we will demonstrate the problem of using donuts like charts. We will propose an alternative using waffle charts. They illustrated the analysis with some circular charts. The problem with such visuals is that human eye is very bad ad comparing surfaces when they are represented by disks.

Continue reading

3D annimation about Measles in USA

In a previous post, we published some data vizualisations (heat map and maps) inspired by an article of The Wall Street Journal about the impact of measles vaccine in the USA. We are now going to present an alternative visualization based on 3D plots. Such plots are not always the best for data vizualisation but they are still interesting, especially when they are annimated.

Continue reading

The impact of vaccines, case of Measles in USA

The Wall Street Journal has published in 2015 an set a of data visualization to illustrate the impact of vaccines on the USA population (DeBold & Freedman - 2015). This article presents heat maps across all 50 USA states for various conditions. For most conditions, such as measles, polio, rubella, the effect of the vaccine is very visible. In this post we are going to replicate the analysis and attempt to generate similar heat maps.

Continue reading

China mainland population density

In an earlier post we mapped the urbanization rate of China at province level. In this post we will go futher by visualizing where Chinese people are living using a gridded population map. We will use the NASA dataset (Population Density Grid, v3 (1990, 1995, 2000)) which consists of estimates of human population by 2.5 arc-minute grid cells. A proportional allocation gridding algorithm, utilizing more than 300,000 national and sub-national administrative units, is used to assign population values to grid cells.

Continue reading

China Urbanisation & Large cities

In this article we are going to plot a map of China urbanization rate per provinces together with Chinese cities with at least 2 millions population. In a nutshell, we’ll get first rural and urban population data from official China statistic bureau, then clean the data, we’ll repeat the same two steps for Chinese largest cities. Secondly, we’ll prepare a map of China with provinces. Then we will add the main Chinese cities and their population and a choropleth of urbanization rate, add main cities

Continue reading

Map of China mainland provinces, municipalities and autonomous regions (in Chinese)

In this article we are going to plot a simple map of China with different levels of subdivisions using both base and ggplot2 systems. In a nutshell, we will have first to get shape files with different subdivision levels, then a bit of data cleaning will be necessary in order to get proper provinces Chinese names. Finally we will plot China base map with subdivisions and add subdivisions names on the map.

Continue reading